When "Healthy" Isn't Healthy: Debugging a 40-Second Cloudflare-to-AWS NLB Delay
How a bad NLB zonal IP, asymmetric routing, and disciplined testing turned an AI hypothesis into proof.
Note: All domains, IP addresses, CIDRs, and resource names in this article are sanitized. The technical relationships reflect the actual investigation.
We had a test API behind Cloudflare, an internet-facing AWS Network Load Balancer (NLB), and an EKS ingress controller. Reports started coming in of agonizing latency: requests were taking almost exactly 40 seconds to return a response.
Curiously, the problem was intermittent across the team. For some engineers, requests succeeded in milliseconds without issue. For others, including my own tests, every single request consistently stalled for 40 seconds. That consistency on affected sessions was far more interesting than a hard failure. DNS was quick. The TCP connection was quick. TLS was quick. Then the request waited.
dns=0.03 tcp=0.05 tls=0.12 ttfb=40.37 total=40.37
dns=0.03 tcp=0.06 tls=0.14 ttfb=40.71 total=40.71
dns=0.11 tcp=0.14 tls=0.19 ttfb=40.72 total=40.72
The response was an HTTP
404, which was expected for the root path we were testing. The problem was not the response code. The problem was that it took 40 seconds to arrive.
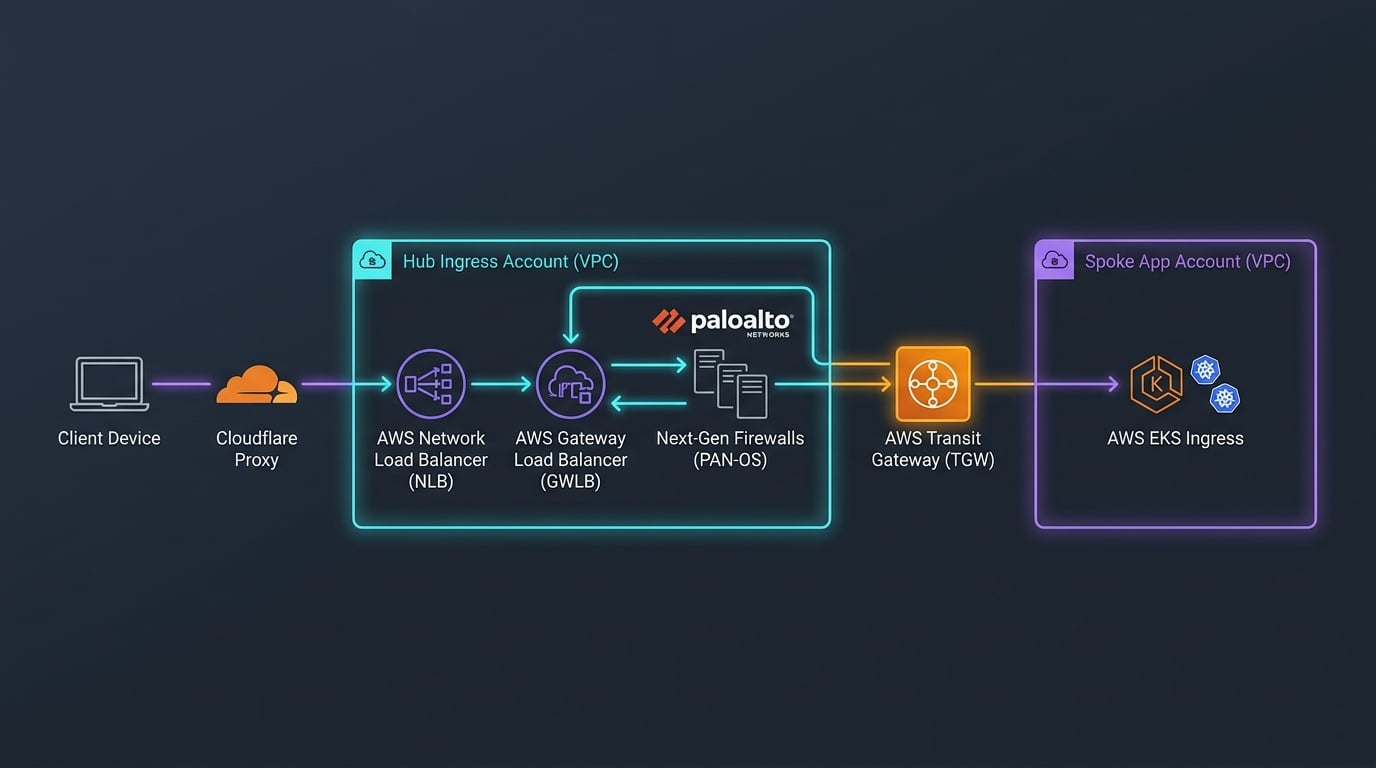
The intended path looked simple at first glance:
Client → Cloudflare Proxy → Hub Ingress Account (NLB → GWLB ⇄ PAN-OS)
  → AWS Transit Gateway (TGW) → Spoke App Account (EKS Ingress)
In enterprise cloud environments, this follows the standard AWS centralized ingress inspection architecture:
- Centralized Ingress/Security Hub Account & VPC: Houses the internet-facing NLB, an AWS Gateway Load Balancer (GWLB), and a fleet of inline Next-Generation Firewalls (Palo Alto PAN-OS VM-Series). Inbound client traffic from Cloudflare hits the NLB, is routed transparently through GWLB to PAN-OS for deep packet inspection, and forwards to the Transit Gateway (TGW).
- AWS Transit Gateway (TGW): Serves as the high-speed regional network hub interconnecting VPCs.
- Application Spoke Account & VPC: Hosts the EKS cluster and ingress controllers running the workloads.
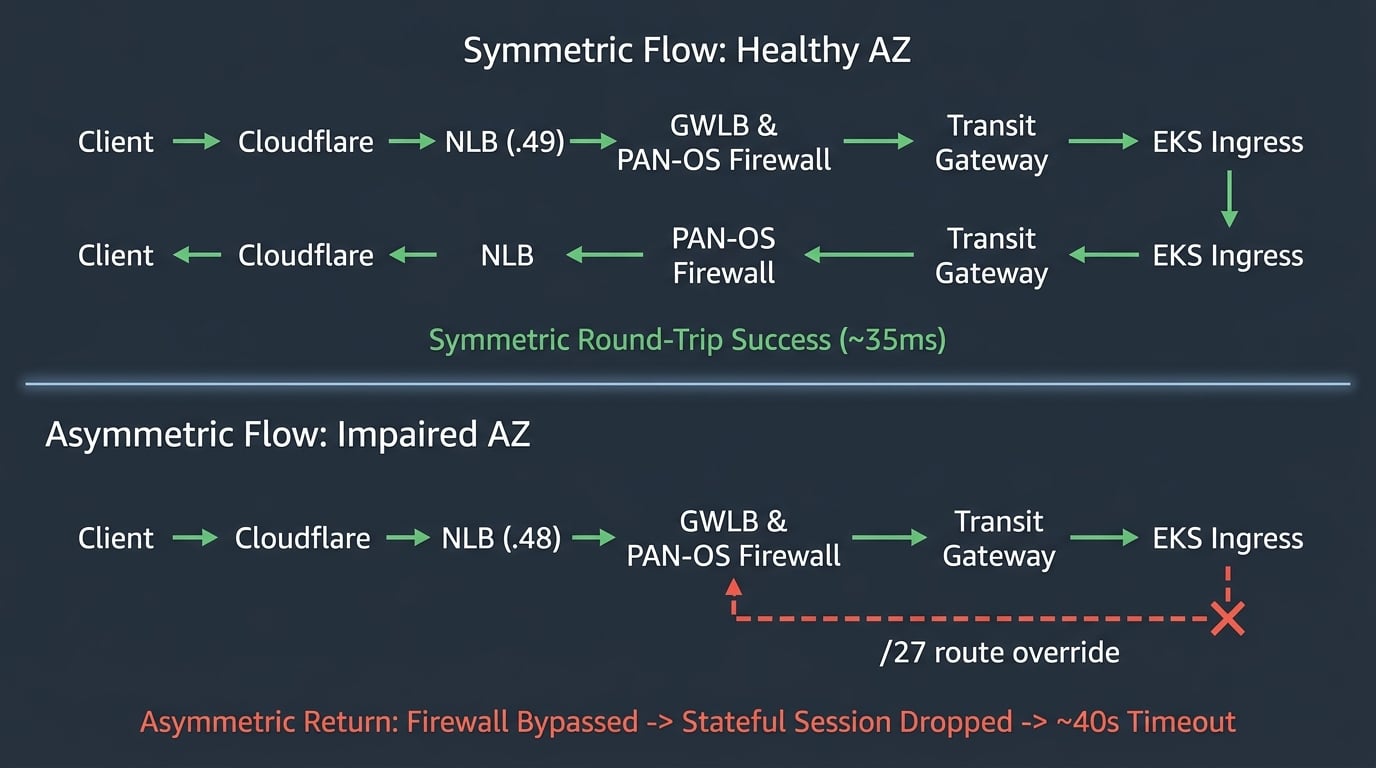
- The Symmetric Return Flow: Responses from EKS must travel back across the TGW into the Hub VPC, re-enter the GWLB / PAN-OS firewall to match existing stateful sessions, return to the NLB, and head back out through Cloudflare to the client.
As usual, this enterprise architecture concealed most of the places where traffic asymmetry could strike.
AI found the first important clue
A member of my team did something I want to encourage. They took our end-to-end ingress path architecture, gathered PAN-OS firewall traffic logs and AWS routing details from the network team, and fed the combined context into an AI model.
They were still ramping up on the networking concepts involved: CIDRs, longest-prefix matching, Transit Gateway route tables, attachments and stateful firewall paths. AI helped them connect the dots between the intended ingress topology and the raw telemetry in the firewall logs, identifying patterns that would otherwise have taken much longer to interpret.
The analysis highlighted two overlapping routes in a Transit Gateway route table:
10.42.48.0/21   → firewall VPC attachment
10.42.48.160/27 → services VPC attachment directly
The test NLB had two private frontend addresses:
10.42.48.180
10.42.49.175
The first address falls inside
10.42.48.160/27. The second does not. Both fall within the broader 10.42.48.0/21.
Because AWS routing uses longest-prefix matching, traffic involving
10.42.48.180 would select the /27. Traffic involving 10.42.49.175 would select the /21.
The AI analysis proposed that this created an asymmetric path around our stateful firewall. One direction traversed the firewall, while the return traffic for the
.48 NLB address matched the more-specific route and bypassed it. The firewall logs appeared consistent with that explanation: incomplete sessions aged out on one path, while successful sessions on the other path closed normally.
It was a very good find. It was also presented with more certainty than the evidence supported. The response declared that it had found the exact problem and even supplied an AWS CLI command to replace the route.
At that point, we had a strong hypothesis. We did not yet have proof.
I took the analysis further with two goals:
- Confirm that the route actually explained the observed 40-second behavior.
- Look beyond the immediate route correction and determine how the application should survive a similar zonal failure in the future.
This was not about proving the AI analysis wrong. It was about separating a valuable discovery from a verified conclusion.
First, establish what Cloudflare was doing
The response headers confirmed that the test hostname was proxied through Cloudflare:
server: cloudflare
cf-cache-status: DYNAMIC
cf-ray: <identifier>
The
CF-Ray header established that the request had traversed Cloudflare. CF-Cache-Status: DYNAMIC told us that Cloudflare was forwarding the request to an origin rather than serving a cached response.
This mattered because “Cloudflare is slow” was still far too broad a description. Cloudflare could be waiting for an origin connection, retrying another origin address, or simply relaying a slow application response.
The timing strongly suggested a timeout-and-retry sequence. While client-side
curl cannot reveal Cloudflare’s internal edge decisions without enterprise logging, Cloudflare’s proxy behavior provides a compelling explanation:
- When connecting to an origin, Cloudflare initiates a TCP handshake. If it receives no
SYN+ACK, it waits out an origin connection timeout of roughly 19 seconds while attempting retransmissions. - If that first attempt fails against an unresponsive origin IP, Cloudflare retries an alternate origin IP.
- Two stalled connection attempts at ~19 seconds each equal ~38 seconds of silence. When the third attempt hits the working zonal NLB IP, the connection completes in milliseconds, yielding the consistent ~40.3-second TTFB we observed.
We recorded this retry behavior as a highly consistent and plausible model, keeping it clearly labeled as an inference from documented proxy behavior rather than origin-side packet capture.
There was also an early distraction involving a production hostname that responded quickly. We later confirmed that it pointed to a different group of servers and had not yet been connected to the production EKS environment. It was not a valid comparison, so we removed it from the evidence. This incident occurred only on the configured test path.
One NLB hostname concealed two different outcomes
The generic NLB hostname resolved to two public addresses, one for each enabled Availability Zone:
198.51.100.20
203.0.113.20
Testing the hostname alone would always allow DNS and the upstream client to choose an address for us. We needed to test each NLB frontend independently while preserving the real TLS server name and HTTP Host header.
The useful
curl feature for that is --resolve:
curl --resolve api-test.example.edu:443:198.51.100.20 \
  -o /dev/null -sS \
  -w 'code=%{http_code} connect=%{time_connect} tls=%{time_appconnect} ttfb=%{time_starttransfer} total=%{time_total}\n' \
  https://api-test.example.edu/
The URL remains
https://api-test.example.edu, so TLS and ingress host routing still receive the correct hostname. Only the destination address is pinned.
Our workstations could not reach the public or private NLB addresses directly because of network controls. Rather than infer what would happen, I deployed a small EC2 test instance in an appropriate AWS network and repeated the test against each private NLB address.
The result was unambiguous:
10.42.49.175 → HTTP 404 in approximately 35 milliseconds
10.42.48.180 → no response before the client timeout
Again, the
404 was not a failure for this test. It showed that TCP, TLS and the ingress path completed quickly enough to return an expected application-layer response.
The other NLB address did not complete the same transaction.
We could now replace the vague statement “the test API is slow” with something much more useful:
Connections through one zonal NLB frontend worked normally. Connections through the other zonal frontend did not.
The route explained the difference
The isolated result matched the route analysis precisely:
10.42.48.180was inside the more-specific10.42.48.160/27route.10.42.49.175used the broader10.42.48.0/21route through the firewall attachment.- The firewall logs showed incomplete sessions for the failing path and normally closed sessions for the working path.
The working hypothesis now looked like this:
View raw Mermaid text diagram definition
flowchart TD
    subgraph Edge ["Public Edge"]
        CF[Cloudflare Proxy]
    end

    subgraph Hub ["Hub Ingress Account (VPC)"]
        NLB_DNS[Generic NLB DNS]
        NLB_BAD[AZ-b NLB Frontend<br/>10.42.48.180]
        NLB_GOOD[Other-AZ NLB Frontend<br/>10.42.49.175]
        GWLB[AWS GWLB]
        FW[PAN-OS Firewalls]
    end

    subgraph Transit ["Interconnect"]
        TGW[AWS Transit Gateway]
        R27[TGW Route: /27 Override<br/>Direct Spoke Attachment]
        R21[TGW Route: /21<br/>Firewall Attachment]
    end

    subgraph Spoke ["Spoke App Account (VPC)"]
        EKS[AWS EKS Ingress]
    end

    CF --> NLB_DNS
    NLB_DNS --> NLB_BAD
    NLB_DNS --> NLB_GOOD

    NLB_GOOD --> GWLB <--> FW
    GWLB --> TGW --> R21 --> EKS
    EKS -.->|Symmetric Return| R21 -.-> GWLB -.-> NLB_GOOD -.-> CF

    NLB_BAD --> GWLB <--> FW
    GWLB --> TGW --> R27 --> EKS
    EKS -.->|Bypasses Firewall via /27| R27 -.->|Asymmetric drop / timeout| SLOW[~19s SYN Timeout & Retry]
The remaining question was whether removing the affected Availability Zone from normal NLB routing would remove the 40-second delay without changing anything else.
Why the healthy target status did not protect us
The NLB target group reported its targets as healthy throughout the incident.
That was not evidence that our per-IP test was wrong. It demonstrated that the target health check and the real client path were answering different questions.
NLB target health checks determine whether registered backend targets respond to the configured health-check protocol, port and path. They do not provide a general guarantee that every real client flow through every NLB frontend, Transit Gateway route and stateful inspection path is symmetric and usable.
The backend targets could pass their configured checks while a connection through one zonal NLB address still failed because of the route taken by the complete flow.
The green indicator was correct within its scope. We had expected it to certify more of the path than it actually tested.
This became one of the most useful lessons from the investigation:
A healthy component does not imply a healthy end-to-end path.
A healthy pod does not prove the ingress path is healthy. A healthy ingress target does not prove every NLB frontend is usable. A healthy NLB target group does not prove that a return path through a stateful firewall is symmetric.
Using ARC zonal shift as a controlled experiment
AWS Application Recovery Controller (ARC) zonal shift is intended to move traffic away from an impaired Availability Zone. In this case, it also gave us an unusually clean diagnostic experiment.
We enabled ARC zonal shift integration only for the test NLB. Because cross-zone load balancing was enabled, AWS required the attached target groups to disable immediate connection termination when targets become unhealthy. Existing connections could then close naturally while new traffic shifted away from the selected zone.
We started a short customer-initiated zonal shift away from the Availability Zone containing
10.42.48.180.
Before the shift, the generic NLB hostname returned both public addresses:
198.51.100.20
203.0.113.20
After the shift, the affected zonal address disappeared from the generic NLB DNS response:
198.51.100.20
Then we repeated the original request through Cloudflare:
ttfb=0.35 total=0.35
ttfb=0.32 total=0.33
ttfb=0.31 total=0.31
ttfb=0.16 total=0.16
ttfb=0.29 total=0.29
Nothing else had changed. We had not modified the application, EKS ingress, firewall policy, Cloudflare proxy configuration or Transit Gateway routes. We had changed only whether the impaired NLB Availability Zone was offered for new connections.
The result was immediate and repeatable:
- With both zones active in DNS, requests averaged ~40.5 seconds.
- With ARC zonal shift redirecting traffic away from the impaired zone, requests completed in 0.16–0.35 seconds.
To close the loop, we performed a full A/B reproduction:
- Cancel the zonal shift: We waited for the NLB’s ~60-second DNS TTL to expire. The generic NLB hostname resumed advertising both public IPs.
- Observe regression: Direct requests through Cloudflare immediately reverted to the ~40-second delay. Meanwhile, a pinned
curl --resolveagainst the working zonal NLB IP still returned responses in ~35ms, proving the application itself was unaffected and only the specific zonal transit was broken.
| Test state | NLB addresses advertised | Observed result |
|---|---|---|
| Broken route + both NLB zones available | Both IPs advertised | ~40.3–40.7 seconds |
| Broken route + ARC zonal shift away from impaired zone | Healthy zonal IP only | 0.16–0.35 seconds |
| Broken route + ARC shift cancelled (A/B reproduction) | Both IPs advertised | ~40.5 seconds |
| Corrected TGW route + both zones available | Both IPs advertised | 0.18–0.32 seconds |
The zonal shift proved beyond doubt that the latency was tied exclusively to the affected NLB zonal path. The direct-address tests had already identified which path failed. The route table and PAN-OS firewall sessions (which showed aged-out, incomplete sessions for the
.48 subnet) explained why.
When the network team corrected the Transit Gateway route table by eliminating the overriding
/27 prefix so traffic flowed symmetrically through the firewall attachment, we reran the isolation tests. Both zonal NLB IPs responded in milliseconds, and end-to-end client requests remained consistently fast. The causal chain was complete.
Fixing the route is necessary, but it is not enough
The route must be corrected. Depending on its original intent, that may mean redirecting the
/27 through the firewall attachment or removing it so that the broader /21 applies.
That decision belongs to the network owners. A syntactically valid route change is not automatically the right architectural change, which is why copying an AI-generated
replace-transit-gateway-route command into AWS would have been premature.
But I did not want to stop at fixing the route.
The incident exposed a failure mode that could happen again for a different reason. A future problem might involve AWS infrastructure, a subnet route, a Network ACL, a firewall path or another zonal dependency. If one NLB frontend becomes unusable while backend health checks remain green, the application could again suffer long delays without a complete outage.
We therefore looked at two additional controls.
ARC zonal shift as the AWS-side recovery control
ARC now gives us a tested way to withdraw an impaired NLB Availability Zone. An operator can start a short zonal shift, observe the result and cancel it when the underlying problem is corrected.
That is valuable, but it still requires detection and an operational decision. We need monitoring that tests each externally reachable zonal path independently, not merely the NLB hostname or backend target group.
Architectural Recommendation: Cloudflare Load Balancing with separate zonal endpoints
The ordinary Cloudflare-proxied DNS record used the generic public NLB hostname. That hostname concealed both NLB addresses behind one origin name.
Configuring the generic NLB hostname as a single origin endpoint does not provide independent health state for each zonal frontend.
AWS provides a zonal DNS name for each NLB frontend:
us-west-2a.example-nlb.elb.us-west-2.amazonaws.com
us-west-2b.example-nlb.elb.us-west-2.amazonaws.com
Alternatively, an internet-facing NLB's static public IP address for each zone can be configured directly.
In an enterprise setup with Cloudflare Load Balancing (a paid add-on), an ideal pool structure would contain two independent origin endpoints, one for each NLB Availability Zone:
- Monitored Endpoint 1:
us-west-2azonal NLB address / DNS - Monitored Endpoint 2:
us-west-2bzonal NLB address / DNS - Health Check Monitor: HTTPS / port 443 with Host header
api-test.example.edutargeting/healthz
In this model, when a single zonal transit path fails, Cloudflare detects the unhealthy zonal endpoint, isolates it, and routes all traffic to the healthy zone automatically, preventing proxy retry delays without requiring manual intervention.
The Low-Cost Alternative: External Synthetic Probing
If Cloudflare Load Balancing is not licensed or available in your tier, you cannot rely on Cloudflare to steer traffic away from a single degraded origin IP automatically.
Instead, the operational pattern is external synthetic monitoring coupled with manual or automated ARC zonal shift:
- Run continuous synthetic health checks (via Datadog, Prometheus Blackbox, CloudWatch Synthetics, or custom probes) directly against each zonal NLB IP using the
curl --resolvetechnique. - If probes against a specific zonal IP consistently fail or timeout while backend target groups report healthy, raise a high-severity zonal degradation alert.
- Use the AWS CLI or Console to initiate an ARC Zonal Shift to immediately evacuate the impaired AZ until the network team addresses the root cause.
The three controls solve different parts of the problem:
| Control | Type | What it provides |
|---|---|---|
| Correct TGW routing | Prevention / Root Cause | Ensures symmetric, clean routing across all paths |
| Per-zone origin health checks | Detection | Catches gray failures hidden by generic NLB hostnames |
| ARC zonal shift | Mitigation / Recovery | Allows operators to evacuate an impaired AZ in seconds |
The role AI actually played
This was not a story in which AI produced a bad answer and experienced engineers rescued the situation. That would be both inaccurate and unhelpful.
AI found the most important technical clue early. When provided with our intended ingress architecture alongside PAN-OS traffic logs, it connected the dots: identifying the more-specific route, correlating it with the failing zonal NLB address, and spotting the incomplete/aged-out firewall sessions. That contributed directly to resolving the incident.
The human work was different:
- Recognizing that the initial evidence supported a hypothesis rather than certainty.
- Obtaining missing context from the relevant teams.
- Discarding an invalid production comparison.
- Building an EC2-based isolation test when workstation access was blocked.
- Testing each NLB frontend independently.
- Using a reversible zonal shift to change one variable at a time.
- Looking beyond the immediate fix to the application's future resilience.
Those are not reasons to use AI less. They are the practices that make AI useful in operational engineering.
The lesson for my team is not “do not trust AI.” It is more precise:
Use AI aggressively to find patterns, interpret unfamiliar material and generate hypotheses. Do not quietly convert its confidence into your own certainty. Own the evidence, the recommendation and the consequences of any change.
An AI-generated command may be technically correct and still be the wrong action. An AI-generated diagnosis may identify a real defect without fully explaining the incident. The engineer communicating the result must know which parts were observed, which were inferred and which still need to be tested.
Incident Resolution & Key Takeaways
The complete test sequence definitively proved the root cause and verified the permanent fix:
- A/B Confirmation: Reverting the ARC zonal shift brought back the ~40.5s delay on generic traffic while the isolated healthy IP remained sub-50ms.
- Permanent Route Remediation: The network team removed the overriding
/27Transit Gateway route, ensuring all traffic to the services VPC traversed the stateful firewall attachment symmetrically. - Post-Fix Verification: Both
curl --resolvezonal tests and repeated end-to-end client requests through Cloudflare returned in ~200–300ms. PAN-OS session monitors confirmed clean bidirectional sessions with zero aged-out drops. - Resilience Established: The team verified ARC zonal shift integration as an active runbook control for any future single-zone impairment.
Conclusion
The visible symptom was a Cloudflare-proxied API that consistently took about 40 seconds to return a response. The application did not fail. The NLB targets remained healthy. No individual dashboard identified the actual problem.
AI gave the team an important lead by identifying a suspicious, more-specific TGW route. We then reduced the problem one layer at a time:
- Cloudflare headers established the public path, and documented proxy retry timeouts (~19s SYN timer) explained the exact ~40s duration.
- Direct address testing (
curl --resolve) isolated one NLB frontend as dead while the other was healthy. - The route table and firewall logs explained the zonal asymmetry.
- ARC zonal shift removed the impaired path and immediately changed the request duration from ~40 seconds to ~0.3 seconds.
- Removing the conflicting route resolved the issue permanently across all zones.
The larger lesson is that “healthy” is always qualified. Healthy according to which check, from which source, through which path and at which layer?
A backend health check cannot prove an entire ingress architecture. A generic hostname can hide materially different zonal paths. A proxy can turn a partial origin failure into consistent latency rather than a visible outage. A plausible diagnosis can be valuable without yet being proven.
The route fix permanently removed this defect. Establishing external synthetic per-zone probing and a tested ARC zonal-shift procedure ensures the application is prepared for the next zonal gray failure, regardless of its cause.
We did not reach that point by rejecting AI or accepting it blindly. AI helped us find the clue. Engineering discipline turned the clue into a testable explanation, and the testing exposed how the system should be made more resilient.
That is the balance I want my teams to learn.